Data Center Site: How Deep Can You Go? Efforts to retrofit subterranean bunkers into functional data center space have been underway for years. But as power requirements and security considerations have intensified, selecting underground sites that are specifically designed from day one to house mission critical infrastructure is a new trend.
Ultra-secure underground data center space is being fueled by projected energy, security and regulatory benefits relative to above ground alternatives.
Showing posts with label Data center cooling. Show all posts
Showing posts with label Data center cooling. Show all posts
Friday, March 21, 2014
Some things to consider when running a data center
As businesses go increasingly digital, the need for data centers to
secure company information is more important than ever before. It is not
only tech giants like Google and Facebook that need a place to house
their information - businesses across the healthcare, government and
industrial sectors are looking to data centers as a solution to their
storage needs. But running a data center is not something that can be
done impulsively. Whether your company has the funds and scale of
operations to occupy its own center or ends up looking into existing
facilities, here are some important considerations to keep in mind to
maximize an enterprise data center operation.
Consider renewable energy solutions
In Hollywood movies, data centers are generally represented as massive,
noise-intensive operations that actively drain energy out of whatever
area they are occupying. This public perception of such facilities is
understandable given that data centers must rely on a constant supply of
energy - after all, their functionality depends on remaining active at
all times. But just because they harness energy sources does not mean
data centers can't function in an environmentally-minded, sustainable
way.
Just ask Google, a company that has been dealing with data
storage needs ever since it rented its first data storage facility - a
closet-sized, 7 foot by 4 foot operation
with a mere 30 computers - in 1998, according to CNET. Google has come a
long way since then, and so has its dedication to sustainable methods
of data center operation. The tech giant now has a vast network of data
centers spanning the globe.
What unites Google's facilities is a singular commitment to renewable energy.
With renewable energy currently powering more than a third of Google's
data storage facilities, the company is always looking for ways to
expand the use of solar and wind power,
according to its site. Because it is challenging to have a renewable
power generator on location, the company did the next best thing: It
reached out to renewable energy providers in the area - such as wind
farms - and made deals to buy energy from them. Among Google's energy
suppliers are wind farms in Sweden and Oklahoma.
Through these sources, the company is not only able to maintain solid
data room cooling practices, but benefit the local community.
Have good outside air cooling
When it comes to maintaining an optimal data room temperature, it's best
to follow the lead of companies well-versed in data storage. Google and
Microsoft are two such businesses, and they both share a commitment to
harnessing natural resources to keep their data centers cool.
In
Dublin, Microsoft has invested more than $800 million to date in order
to build a data center that covers almost 600,000 square feet. The
enormous size of the facility would seem to present a major cooling
challenge, but the company has been able to surmount that by using fresh air cooling,
Data Center Knowledge reported. By building the center in Ireland,
where the temperature remains optimal for data room cooling, Microsoft
is able to maximize the location as a natural cooling solution - a move
that saves significant energy costs while keeping the company
environmentally friendly as well. And its commitment to environmentally
sound solutions does not end with cooling: the center also recycles 99
percent of the waste it produces.
Google has a similarly cooling-minded approach with its data facility in Finland, which it hopes will be almost completely powered by
wind energy by 2015, according to Data Center Knowledge. The wind
energy will come from a wind park located nearby. But the center is not
waiting until then to implement good temperature practice. Instead of
relying on chillers and other machine-based cooling techniques, Google
relies on seawater from a nearby Gulf to cool the facility. Its efforts in Finland are part of a broader effort to expand the Google sphere of influence.
"The
Google data center in Hamina offers Eastern Finland a tremendous
opportunity to jump from the industrial to digital age," said Will
Cardwell, a professor at a nearby university.
But just as important as what goes on inside a center is the
environment around it. That is because data centers are invariably
affected by the physical location in which they are located. With that
in mind, here are some more things to look into in order to maximize
your data center potential.
Choose the location wisely
Considering that data centers are necessarily connected to the physical
environment they inhabit, it is important to pinpoint the best location
possible. Data centers are always going to require top-notch
capabilities to maintain a good server room temperature, but the ease
with which that happens can depend on the location of the center. As
always, Google is at the top of the game with regard to location
selection. Its Hamina, Finland center is strategically placed near the Gulf of Finland, enabling an easy and natural data room cooling solution.
But Google is not the only company maximizing natural environments for data center growth. Iron Mountain specializes in underground data center
solutions, according to Data Center Knowledge. Formerly a storage
company for physical records, Iron Mountain already had a 145-acre
underground storage facility in a former limestone mine before it got
into the data center business. This location turned out to be perfect
for data center needs. Blocked from the sunlight and other external heat
sources, the underground facility stays at about 52 degrees without any
kind of additional cooling function. An underground lake provides
further protection against ever needing to bring in a machine cooling
system. The company's so-called "data bunker" gained so much popularity
that Iron Mountain decided to expand its sphere of operations.
Give back to the community the center is in
Data centers often require a big fleet of staff to operate. Fortunately,
they're usually built near communities from which workers can be hired.
But as much as data centers plan to benefit from the community they
inhabit, it is just as important to look for ways to give back. This
kind of behavior encourages connectedness with the community and
improves the reputation of the center - and therefore the company - in
the public eye.
Google paid special attention to the local
community as it developed its Hamina center. When they began mapping out
the concept for the center, Google realized that construction would
take about 18 months. And so they turned to the locals for help. In the
process, they provided steady employment for 800 workers
in the engineering and construction sectors, according to Data Center
Knowledge. Google's willingness to involve locals in the construction
process helped forge a lasting bond between the tech giant and the city.
This bond did not go unnoticed.
"Google's investment decision is important for us and we welcome it warmly," Finnish president Jyrki Katainen said.
And for those who work at the center, life is good.
"No
two days are the same as we change our roles around frequently to keep
things fresh and new," said Julian Cooper, a hardware operations worker at the facility.
Be prepared to surmount environmental obstacles
In the event of a disaster like a hurricane or earthquake, it is vitally
important for all enterprises - especially data centers - to make sure
their stock is safe. Iron Mountain understands the principle of
environmental preparadness quite well, which is why they offer
underground data storage solutions. By storing data underground, Iron
Mountain protects it against any conceivable natural disaster. This
nature-prove construction is especially important for companies like
Marriott, which chose to house data at the Iron Mountain bunker because
of the sense of complete security it afforded.
"We have always had
a rigorous and constant focus on having disaster preparedness in
place," said Marriott operational vice president Dan Blanchard. "Today
we have a data center that provides Marriott with a tremendous
capability for disaster recovery, and we have a great partner in Iron
Mountain."
According to tech journalist David Geer, earthquakes pose a huge threat to data centers in
many areas around the world, since they can be difficult to predict and
potentially cause large-scale damage. If a company intends to build its
facility in an area susceptible to earthquakes, it should apply the
most stringent safeguards, including building a center that is capable
of withstanding a quake one degree higher than the requirement for the
zone it occupies.
Friday, March 14, 2014
Deep underground in Butler County, the Iron Mountain National Data
Center functions like its own little city. With more than 3,000 badged
employees, the former mine has its own fire department, restaurant,
transit systems, water treatment center, and medical center. (Justine
Coyne/Pittsburgh Business Times).
But what may be most surprising about this unique facility, located
outside of Pittsburgh in Boyers, is the treasures that are stored
inside.
Formerly a limestone mine owned by United States Steel Corp.
(NYSE: X) in the early 1900s, today the mine houses everything from
original prints of classic motion pictures, to data storage for more
than 2,300 business and government agencies across the U.S.
Located 220 feet underground, Nick Salimbene,
director of business development for Iron Mountain, said what makes the
facility so unique is that it is virtually impervious to natural
disasters. Salimbene said being housed underground also provides a
stable environment that naturally maintains a temperature of 52 degrees.
Of the 145 acres that are developed, Salimbene said about 70 percent
is used for physical storage. But demand is shifting toward more data
storage. He said the demand for data storage has been increasing between
20 percent and 30 percent annually in recent years. Today, he said
about 80 percent of what is coming into the center today is data.
For the privacy of its customers, Iron Mountain does not disclose who
uses the Boyers facility by name. But it includes many big names. One
tenant Salimbene could discuss is Corbis Corp., which houses its collection of over 20 million photographs .
"There's a little bit of everything here," Salimbene said. "But the
most important thing for us, is that our customers feel secure having
their items located here."
Obviously, with such valuable objects in its facility, security is very tight at Iron Mountain, with armed guards keeping watch 24 hours a day, seven days a week.
"We have companies trusting us with their most valuable assets," Salimbene said. "That's not something we take lightly."
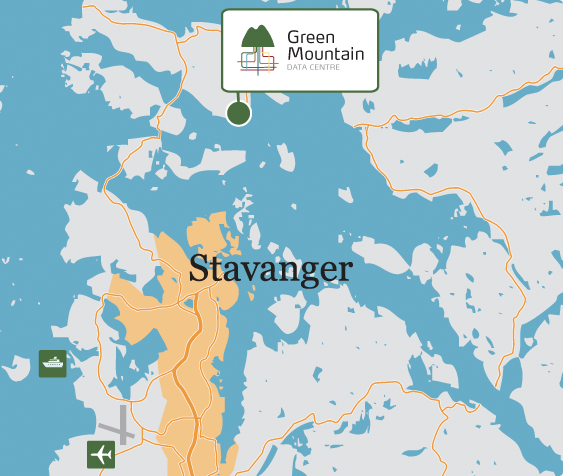
Green Mountain Data Center
Located inside the mountain in a former NATO ammunition depot (the largest in northern Europe)
Built for the highest military security level. Secured against electromagnetic pulses (EMP)
"Nuclear secure" facility, secured against sabotage and direct attack from the sea.
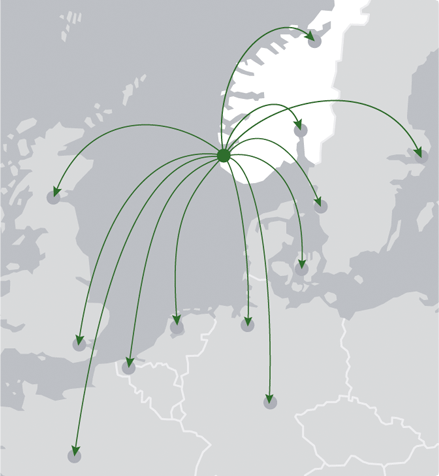
Green Mountain Data Center Green Mountain Data Center a prime piece of real estate tucked inside a scenic Norwegian mountain. Built next to a cool water fjord and surrounded by evergreens and lush rock-clinging mosses, the space boasts of bright, airy subterranean halls carved out of natural cave walls and almost transcendental settings above ground. This will be the comfortable new home for many of Norway’s data servers. The Green Mountain Data Center is one of the first pioneering data centers that will greatly reduce its costs by harnessing the cooling power of the environment, namely, the steady flow of cool water from an adjacent fjord. Alas, the grass seems to be consistently always greener in Scandinavia.
The Green Mountain Data Center contains nine ‘Mountain Halls’—each spanning well over 1,000-square-meters of space to host rows and rows of servers—a workshop, and an administration building. Its servers will be hooked up to an uninterrupted supply of power from a total of eight independent generators as well as three supply lines connected to the central Norwegian network, and its carbon footprint has been thoroughly eliminated.
Of course its most compelling feature, aside from its generally pleasant, Hobbit-like atmosphere noted by Gizmodo, is the cooling system, which relies on the nearby Rennesøy fjord to provide an abundance of cold water year round to cool its resident motherboards. Facebook has gone a similar route by planting a server farm in the Arctic, but we wouldn’t be hard pressed to say that we like the hospitable environment of this data farm better, and it’s nice to see yet another Scandinavian mountain bunker to add to our favorites!
The Mountain Hall
Approx. 21,500 m2 floor space in the mountain
The areas consists of:
– 6 mountain halls each of 1,855 m2
(11 x 164 m each) in size
– 2 mountain halls of 1,546 m2 (19 x 82 m each) in size
- 1 Mountain hall with internal structure 1,370 m2 in size
- I.e. combined mountain halls of 15,692 m2
- Warehouse/workshop 520 m2
- Administration building 840 m2
- Quay w/"roll on-roll off" option
Fire safety and fire
protection
Closed caverns enable the use
of inert / hypoxic air ventilation
Reduced oxygen level to prevent fire and smoke
- 02 reduced to 15 -16 %
- Fire cannot arise as the combustion process
does not get enough oxygen
- Corresponds to an altitude of approx. 3,000 m
Hypoxic air ventilation/Inert ventilation system
- Reduces/limits smoke formation
- Prevents combustion/fire
- Ensures continuous operation
- No fire damage
- No secondary extinguishing damage (corrosion,
harm to the environment, poisoning, etc.)
- No problems with hard disks due to the triggering
of fire extinguishing equipment
Safe as a vault
Located inside the mountain in a former NATO
ammunition depot (the largest in northern Europe)
Built for the highest military security level
- Secured against electromagnetic pulses (EMP)
- "Nuclear secure" facility
- Secured against sabotage and direct attack
from the sea
"Best in class" data security
Communication
- redundancy
High capacity and redundancy
Local broad band operators
Good connectivity to the world
Multiple high capacity lines to Oslo
Multiple high capacity lines directly to the UK
Multiple high capacity lines to continental Europe
Carrier neutral availability
SubTech Data Center is a ground-level facility built inside solid limestone,
offering security unmatched by any other data center facility. SubTech is located in Kansas City, which provides one of the lowest utility costs in the country and is ranked #2 in the United States for enterprise data center operating affordability. SubTech's data center solutions are reliable and flexible, offering maximum power and connectivity for your robust data center needs. Site plans by
http://www.totalsitesolutions.com/
Expanding or needing data center space? SubTech has millions of square feet available for IT and raised floor area. The facility provides clients with data center space ranging from 5,000 - 100,000+ square feet with 16' clear ceiling heights throughout. The initial 100,000 s.f. can be built out in 20,000 s.f. modules. Click here to download our site plan. http://www.subtechkc.com/site_plan.pdf
Ora Reynolds (left), president of Hunt Midwest Real Estate Development, and Tammy Henderson, director of real estate marketing and governmental affairs, are preparing for when a portal (background) will be the front door to an underground data center.
The Kansas City-based company plans to build a 40,000-square-foot data center in Hunt Midwest SubTropolis. The massive underground business complex is roughly northeast of Interstate 435 and Missouri Highway 210 in Kansas City. Construction on the estimated $30 million SubTech project will begin once Hunt Midwest signs a tenant or tenants for the first 20,000 square feet, company President Ora Reynolds said. Reynolds said the company originally planned a 100,000-square-foot project but scaled back after an unsuccessful attempt in the summer to add state tax incentives for data centers to a bill aimed at retaining automotive jobs. Missouri is at a disadvantage, she said, because Kansas, Nebraska, Iowa and Oklahoma offer financial breaks for data centers. “The investment in a data center is so much more expensive than a regular building,” Reynolds said. “The investment is so large you can’t do ‘If you build it, they will come’ if you don’t think you can compete.” Reynolds said the company envisions a Tier 3 facility, meaning it has redundant power and cooling systems, with the ability to expand in 20,000-square-foot increments. “The thing that we’re saying is the biggest advantage, and what makes us different, is we have 8 million square feet that has been mined out and has not been developed at the present time,” Reynolds said. “Somebody who’s out there and says, ‘I need 20,000 square feet now, but I know I’m going to grow and need 100,000 square feet in the next five years,’ we can accommodate them while somebody who has an office building wouldn’t let half the building stay empty.” She said Hunt Midwest would be strictly a landlord, preferring to find a managed services/collocation firm to become the main tenant, subleasing rack and cabinet space to smaller companies or leasing entire data suites or powered shells — where the tenants install most of the technical infrastructure themselves. The data center business has taken off in recent years as companies have looked for options to remotely operate or back up data networks. New York-based Tier 1 Research said in a Sept. 23 report that demand has outstripped supply in many markets because the economy has slowed construction and financing of new data centers. The underground data center is relatively new in the industry, despite the obvious increase in security and resistance to natural disasters. Tier 1 analysts Jason Schafer and Michael Levy said in a separate report looking at the SubTech project that so-called data bunkers have had trouble attracting tenants in other markets because of the added complexity of supplying power and getting rid of excess heat and moisture. They said that SubTech does have size and the ability to grow in phases going for it but that it will run into the same skepticism other operators encounter. “This isn’t to say that there isn’t a market for a secure underground data center facility,” they wrote. “It just fits the needs of fewer types of tenants that are likely comparing all data center providers.” Cavern Technologies operates a 40,000-square-foot data center in the underground Meritex Lenexa Executive Park. Cavern President John Clune said the company has grown from four customers three years ago to 35. “Our market has really taken off,” he said, adding that not having to construct an actual building and underground’s cooler air temperatures let Cavern compete on cost. “The economics of the underground allow us to provide more space for the money.” Clune said that data centers typically charge as much as $1,200 a rack but that he charges $2,900 for 250 square feet — enough room for four racks. “It’s when people come down here that the light goes on,” he said. Numerous area companies operate their data centers, including some in underground space. Overland Park-based Sprint Nextel Corp. has three data centers supporting network operations, with two built into earthen embankments, spokeswoman Melinda Tiemeyer said. Other companies use underground caves to store computer data tapes.
What is SubTropolis?
SubTropolis was created through the mining of a 270-million-year-old limestone deposit. In the mining process, limestone is removed by the room and pillar method, leaving 25-foot square pillars that are on 65-foot centers and 40 feet apart.
The pillars’ even spacing, concrete flooring and 16-foot high, smooth ceilings make build-to-suit facilities time and cost efficient for tenants. A tenant requiring 10,000 to one million square feet can be in their space within 150 days. SubTropolis is completely dry, brightly lit, with miles of wide, paved streets accessed at street level.
Hunt Midwest SubTropolis sets the standard for subsurface business developments.
Data center cooling is becoming a continually greater challenge as blade servers make it possible to pack more and more computing power into ever smaller spaces. A standard server cabinet dissipates on the order of 3 kilowatts of power, while partitioned blade servers can dissipate up to 5 times as much. While it is clear that many companies will need to make expensive expansions to their air conditioning systems to accommodate increases in power density, simply increasing air conditioning capacity is not the most efficient way to address this problem.
Air conditioning must be provided where it is needed and the ideal cooling arrangement usually involves the careful management of cool and warm air flows. “Enterprises must … carefully factor in the power and cooling demands of these blades,” says a recent Gartner Group report. “Many organizations will not be able to achieve optimum density because of environmental limitations.” ASHRAE’s Thermal Guidelines for Data Processing Environments (2004) says that temperatures should be maintained between 20 degrees Celsius and 25 degrees Celsius in the server room. As temperatures rise, failure becomes a real possibility, which can lead to downtime and even data loss.
The challenge was especially great in a recent project where the computer room air conditioner (CRAC) units were located in mechanical rooms on either side of the server area. This approach makes it possible to keep the server area locked and sealed even while the CRAC units are being serviced. The room was originally designed so that cold air would flow out of the CRAC units, under the raised floor, and up through perforated tiles into the server area, forming cold aisles between racks of servers. The cold air would then be drawn into the air intakes of the server racks, where it would take on heat from the equipment. The hot air would then exit from the backs of the servers into hot aisles, where it would be drawn up to the ceiling and through perforated panels for return to the CRACs.
One approach to estimating cooling requirements for data centers involves the use of hand calculations to estimate the performance of various alternatives. The problem with these calculations is that they require many simplifying assumptions, thus limiting their accuracy in practical applications. Another approach is the use of energy analysis programs that accept as input a description of the building layout, systems, construction, usage, and utility rates, along with weather data. The limitation of this type of program is that is primarily intended to evaluate energy usage and cost and thus can only predict average temperatures for a particular space. Of course, knowing that the average temperature in the data center is 22 degrees Celsius would be small comfort if the air temperature near one critical server is 29 degrees Celsius.
In the past, about all that engineers could do was to make sure the average temperatures were right and hope that there wasn’t too much variation in the data center. In this building, because of the unique design, there was a real risk that after the building was finished temperatures in the data center would be too high. It would then be necessary to go through a lengthy and expensive trial and error process in order to remedy the problem.
Facilities Engineering Associates (FEA) felt that computer simulation was essential to resolve the unique nature of the cooling problems in this application. CFD can provide enormous assistance by calculating and graphically illustrating the complete airflow patterns, including velocities and distributions of variables such as pressure and temperature. They selected Fluent Incorporated, Lebanon, NH, as consultants to perform the analysis because of Fluent’s leading position in the CFD industry and its experience in addressing heating, ventilation, and air conditioning applications. Their goal was to identify potential problems in the room prior to construction, in order to prevent them from occurring later on, which would require costly downtime for after-the-fact modifications. The process of simulating airflow in a data center has been greatly simplified by the development of Airpak CFD software from Fluent Inc., because it is designed specifically for modeling internal building flows.
Pathlines colored by temperature for the perpendicular rack case, simulated as part of the proof-of-concept phase of the project
Pathlines colored by temperature for the parallel rack proof-of-concept case
Simulating the proof-of-concept designs
The Fluent consultant assigned to the project began by modeling the geometry of the two proposed proof-of-concept designs. The main goal of this analysis was to evaluate the placement of the high density rack relative to the position of the CRAC units in the data center room. In one proposed layout, the CRAC units are parallel to the server racks and in the other design, they are perpendicular. The server and mechanical rooms were defined as boxes, and the raised floor, physical rack locations, CRAC units, suspended ceilings, beams, and tiles were created for each case. One server rack was assigned a higher power density than the others, and the impact of its presence and location in the room for each case was studied. The simulation results provided the air velocities, pressures, and temperatures throughout the server room and lower plenum, and were used to illustrate the resulting air flow patterns for each layout. The global air flow patterns showed that the design worked as intended, with the air rising through the perforated sections of the floor, flowing through the racks, and exiting through the returns in the ceiling.
Zoomed view of pathlines in the vicinity of high-density rack for the perpendicular proof-of-concept case
While the design seemed to be working well at first glance, closer examination showed several serious problems. The figure above shows the flow in the area of the high-density rack, which is positioned next to the wall in the perpendicular orientation case. Cooling air is drawn into the cold aisle between this rack and the adjacent low-density rack through the perforated floor tiles. Following the temperature-coded pathlines, it can be seen that the hot air exiting from the high-density rack circles over the top of the rack and re-enters the cold aisle, where it is drawn into the upper intake portion of the neighboring low-density rack. The lower portion of the low-density rack is not affected. It continues to be properly cooled by air entering through the floor tiles. Temperature contours on the rack intakes (see figure below) further illustrate the problem. A similar problem occurs for the parallel orientation case, where the high density rack is positioned between two normal density racks. Hot air exiting from the high-density rack circles above and around the sides of the rack and re-enters the cold aisle, compromising the cooling air that is delivered through the floor.
Surface temperatures on the rack inlets in the cold aisles for the perpendicular proof-of-concept case
Evening out the heat load
The proof-of-concept simulations demonstrated that the root cause of the problem was with the layout of the high-density racks. It was apparent that the original design concentrated the high load racks in a single row, which created a hot spot in that area. Working within the constraints provided by the client, engineers repositioned the servers to even out the heat load throughout the room. The engineers also addressed the fact that the heat load of the different racks varies widely, from 1 to 7 kilowatts. The original model used the power ratings provided by the blade manufacturers, but the engineers recognized that deviations from the rated values could greatly impact the accuracy of the simulations. They therefore measured the power draw of each unit and discovered that the actual values were considerably less than the rated ones. Using this information, along with information from the simulations, the engineers were able to determine the air conditioning capacity required to cool the room. The calculation was based on the requirement that the failure of any single CRAC unit would not cause the temperature to rise to dangerous levels. Finally, they examined the predicted pressure losses throughout the room and lower plenum to determine the requirements of the fans used to drive the system.
FEA and Fluent engineers also evaluated the effect of the plenum height on the flow patterns in this region. The results showed that a jet of air traveled through the 10.5 inch high plenum and struck the opposing wall, causing a recirculation pattern with nonuniform flow conditions and localized high pressure zones. Assuming that the height of the plenum was the cause of the problem, engineers generated several different models with a plenum of various heights. They discovered that a plenum height of approximately 16.5 inches was the smallest that would promote smooth air flow into the server room. In order to straighten out the airflow through the perforated floor tiles, engineers specified ductwork with an aerodynamic shape that creates a uniform static pressure across the entire space and also absorbs noise.
This application demonstrates that CFD can be used to resolve problematic areas within existing or planned data centers. By using CFD in the design process, potential cooling problems, such as those illustrated in this example, can be identified before they occur, saving the time and expense required for repairs and retrofitting, once the center is on-line.
Technology based companies are building new data centers in old mines, caves, and bunkers to host computer equipment below the Earth's surface.
Underground Secure Data Center Operations have a upward trend.
Operations launched in inactive gypsum mines, caves, old abandoned coal mines, abandoned solid limestone mines, positioned deep below the bedrock mines, abandoned hydrogen bomb nuclear bunkers, bunkers deep underground and secure from disasters, both natural and man-made.
The facility have advantages over traditional data centers, such as increased security, lower cost, scalability and ideal environmental conditions. There economic model works, despite the proliferation of data center providers, thanks largely to the natural qualities inherent in the Underground Data Centers.
With 10,000, to to over a 1,000,000 square feet available, there is lots of space to be subdivided to accommodate the growth needs of clients. In addition, the Underground Data Centers has an unlimited supply of naturally cool, 50-degree air, providing the ideal temperature and humidity for computer equipment with minimal HVAC cost.
They are the most secure data centers in the world and unparalleled in terms of square footage, scalability and environmental control.
Yet, while the physical and cost benefits of being underground make them attractive, they have to also invested heavily in high-speed connectivity and redundant power and fiber systems to ensure there operations are not just secure, but also state-of-the-art.
There initially focused on providing disaster recovery solutions, and backup co-location services.
Clients lease space for their own servers, while other provides secure facilities, power and bandwidth. They offers redundant power sources and multiple high-speed Internet connections through OC connected to SONET ring linked to outside connectivity providers through redundant fiber cables.
Underground Data Centers company augments there core services to include disaster recovery solutions, call centers, NOC, wireless connectivity and more.
Strategic partnering with international, and national information technology company, enable them to offer technology solutions ranging from system design and implementation to the sale of software and equipment.
The natural qualities of the Underground Data Centers allow them to offer the best of both worlds premier services and security at highly competitive rates.
Underground Data Centers were established starting in 1990's but really came into there own after September 11 attacks in 2001 when there founders realized the former mines, and bunker offered optimal conditions for a data center. The mines, and bunkers offered superior environmental conditions for electronic equipment, almost invulnerable security and they located near power grids.
Adam Couture, a Mass.-based analyst for Gartner Inc. said Underground Data Centers could find a niche serving businesses that want to reduce vulnerability to any future attacks. Some Underground Data Centers fact sheet said that the Underground Data Center would protect the data center from a cruise missile explosion or plane crash.
Every company after September 11 attacks in 2001 are all going back and re-evaluating their business-continuity plans, This doesn't say everybody's changing them, but everybody's going back and revisiting them in the wake of what happened and the Underground Data Center may be just that.
Comparison chart: Underground data centers
Five facilities compared
Robert L. Mitchell
Name
InfoBunker, LLC
The Bunker
Montgomery Westland
Cavern Technologies
Iron Mountain The Underground
Location
Des Moines, Iowa*
Dover, UK
Montgomery, Tex.
Lenexa, Kan.
Butler County, Penn.*
In business since
2006
1999
2007
2007
Opened by National Storage in 1954. Acquired by Iron Mountain 1998.
Security /access control
Biometric; keypad; pan, tilt and zoom cameras; door event and camera logging
CCTV, dogs, guards, fence
Gated, with access control card, biometrics and a 24x7 security guard
24-hour armed guards, visitor escorts, magnetometer, x-ray scanner, closed-circuit television, badge access and other physical and electronic measures for securing the mine's perimeter and vaults
Distance underground (feet)
50
100
60
125
220
Ceiling height in data center space (feet)
16
12 to 50
10
16 to 18
15 (10 feet from raised floor to dropped ceiling)
Original use
Military communications bunker
Royal Air Force military bunker
Private bunker designed to survive a nuclear attack. Complex built in 1982 by Louis Kung (Nephew of Madam Chang Kai Shek) as a residence and headquarters for his oil company, including a secret, 40,000 square foot nuclear fallout shelter. The office building uses bulletproof glass on the first floor and reception area and 3-inch concrete walls with fold-down steel gun ports to protect the bunker 60 feet below.
Limestone mine originally developed by an asphalt company that used the materials in road pavement
Limestone mine
Total data center space (square feet)
34,000
50,000
28,000 plus 90,000 of office space in a hardened, above-ground building.
40,000
60,000
Total space in facility
65,000
60,000
28,000
3 million
145 acres developed; 1,000 acres total
Data center clients include
Insurance company, telephone company, teaching hospital, financial services, e-commerce, security monitoring/surveillance, veterinary, county government
Banking, mission critical Web applications, online trading
The Editor:
My Name is Gary E.Weller; this is what I am thinking about in the time and space when I am writing this newsletter, you will never know what to expect from my mind or others. When I let my hair grow long some folk say I look like Albert Einstein what a compliment, I will try to keep my hair as long as I can. I prefer to Die on my feet than Live on my knees!"
ACAE - Air conditioning airflow efficiency, the amount of heat removed per standard cubic foot of airflow per minute
AHU - Air handling unit
Air Mixing - The unintended mixing of cold and hot air
Airside Economizer - An economizer that directs exterior air into the data center when the air temperature is at or below the cooling set point
Aisle - The open space between rows of racks. Best-practice dictates racks should be arranged with consistent orientation of front and back to create ‘cold'and ‘hot'aisles.
AMS - Asset management system
ASHRAE - American Society of Heating, Refrigerating and Air-Conditioning Engineers is an international technical society organized to advance the arts and sciences of air management.
BACnet - A data communication protocol for building automation and control networks BAS - Building automation system Blanking Panel - A device mounted in unused U spaces in a rack that restricts bypass airflow, also called blanking or filler plates BMS - Building management system, synonymous with BAS, AMS and other computer-based tools used to manage data center assets BTU - British thermal until, a standard measure of cooling equipment capacity Bypass Airflow - Conditioned air that does not reach computer equipment, escaping through cable cut-outs, holes under cabinets, misplaced perforated tiles or holes in the computer room perimeter walls. C - Degrees Celsius
C/H - Cooling/Heating Cabinet - Device for holding IT equipment, also called a rack CAC - Cold aisle containment system that directs cooled air from air conditioning equipment to the inlet side of racks in a highly efficient manner CADE - Corporate average data center efficiency CapEx - Capital expense, the cost of purchasing capital equipment Carbon Footprint - A measurement of the volume in pounds of Carbon Dioxide generated by business operations. CFD - Computational fluid dynamics, scientific calculations applied to airflow analysis CFM - Cubic feet per minute, an airflow volume measurement Close-Coupled Cooling - Cooling technology that is installed adjacent to server racks and enclosed to direct airflow directly to the rack without mixing with DC air Coefficient of Effectiveness (CoE) - Uptime Institute metric based on the Nash-Sutcliffe model efficiency coefficient Cold Aisle - An aisle where rack fronts face into the aisle. Chilled airflow is directed into this aisle so that it can then enter the fronts of the racks in a highly efficient manner. Cold Spot - An area where ambient air temperature is below acceptable levels. Typically caused by cooling equipment capacity exceeding heat generation. CR - Computer room CRAC - Computer room air conditioner (pronounced crack) that uses a compressor to mechanically cool air CRAH - Computer room air handler (pronounced craah) that uses chilled water to cool air Critical Load - Computer equipment load delivered by PDU output CSI - Cold supply infiltration index, quantifies the amount of hot air mixing with cold inlet air prior to entering the rack. Cutout - An open area in a raised floor that allows airflow or cable feeds CW - Chilled water DC - Data center DCiE - Data center infrastructure efficiency is an efficiency measure that is calculated by dividing the IT equipment power consumption by the power consumption of the entire data center. This measure is the inverse of PUE. Dead Band - An HVAC energy saving technique whereby sensitivity set points of equipment are set more broadly to improve coordination of the equipment and avoid offsetting behaviors, also dead band control strategy Delta T - Delta temperature, the spread between the inlet and outlet air temperatures of air conditioning equipment, measured as the maximum achievable difference between inlet (return) and outlet (supply) temperatures. This is not the astronomical measurement of Terrestrial Dynamical Time minus Universal Time. Dewpoint - The temperature at which air reaches water vapor saturation, typically used when examining environmental conditions to ensure they support optimum hardware reliability D/H - Dehumidifying/Humidifying Dry-Bulb Temperature - The temperature of the air measured using a dry-bulb thermometer, typically taken in conjunction with a wet-bulb reading in order to determine relative humidity EFC - Equivalent full cabinets, the number of full cabinets that would exist if all the equipment in the data center were concentrated in full cabinets ESD - Electrostatic discharge, more commonly ‘static discharge' F - Degrees Fahrenheit Ft2 - Square feet or foot GPM - Gallons per minute HAC - Hot aisle containment system that directs heated air from the outlet side of racks to air conditioning equipment return ducts in a highly efficient manner Harmonic Distortion - Multiples of power frequency superimposed on the power waveform that causes excess heating in wiring and fuses Heat Exchanger - A device used to transfer heat energy, typically used for removing heat from a chilled liquid system HDG - Hot dipped galvanized Hot Aisle - An aisle where rack backs face into the aisle. Heated exhaust air from the equipment in the racks enters this aisle and is then directed to the CRAC return vents. HPDC - High-performance data center, a data center with above average kW loading, typically greater than 10kW/rack Hot Spot - An area, typically related to a rack or set of racks, where ambient air temperature is above acceptable levels. Typically caused by heat generation in excess of cooling equipment capacity. Hp - Horsepower Hr - Hour HVAC - Heating, ventilation and air conditioning system, the set of components used to condition interior air including heating and cooling equipment as well as ducting and related airflow devices In-Row Cooling - Cooling technology installed between server racks in a row that delivers cooled air to equipment more efficiently Inlet Air - The air entering the referenced equipment. For air conditioning equipment this is the heated air returning to be cooled, also called return air. For racks and servers this is the cooled air entering the equipment. IP - Internet protocol, a communications technology using the internet for communications. IR - Infrared spectrum used by thermal imaging technologies JVM - Java virtual machine, Java interpreter. Software that converts the Java intermediate language into executable machine language. kBTU - Kilo British thermal unit, one thousand BTU, a unit of measurement for the cooling capacity of a CRAH kCFM - Kilo-cubic feet per minute, 1000 CFM kV - Kilovolt kW - Kilowatts kWc - Kilowatts of cooling, alternate unit of measurement for the cooling capacity of a CRAH kWh - Kilowatt hours kVA - Kilovolt amperes = voltage x current (amperage) KVM - Keyboard, video, mouse; an interface technology that enables users to access multiple servers remotely from one or more KVM sites. More obscurely, can also mean K Virtual Machine: a version of the Java Virtual Machine for small devices with limited memory. Latent Cooling Capacity - Cooling capacity related to wet bulb temperature and objects that produce condensation Line Noise - Distortions superimposed on the power waveform that causes electromagnetic interference Liquid Cooling - A general term used to refer to cooling technology that uses a liquid circulation system to evacuate heat as opposed to a condenser, most commonly used in reference to specific types of in-row or close-coupled cooling technologies Load - The kW consumption of equipment, typically installed in a rack. Also, the heat level a cooling system is required to remove from the data center environment MAH - Makeup air handler, a larger air handler that conditions 100% outside air. Synonymous with MAU. Make-Up Air - The conditioned air delivered by a MAU or MAH MAU - Makeup air unit, a larger air handler that conditions 100% outside air. Synonymous with MAH. Maximum Temperature Rate of Change - An ASHRAE standard established to ensure stable air temperatures. The standard is 9 degrees F per hour. MERV - Minimum efficiency reporting value , ASHRAE 52.2, for air filtration measured in particulate size. N+1 - Need plus one, a redundancy concept where capacity is configured to include planned capacity plus one additional device to enable continued operations with the failure of one system in the configuration. This presumes immediate detection and remediation of the failed unit. NEBS - Network equipment-building system design guidelines applied to telecommunications equipment No. - Number Nominal Cooling Capacity - The total cooling capacity of air conditioning equipment, includes both latent and sensible capacities. Due to humidity control in data centers, the latent capacity should be deducted from nominal capacity to determine useful capacity OpEx - Operating expense, the ongoing expenses related to operating the data center Overcooling - A situation where air is cooled below optimum levels. Typically used in reference to rack inlet temperatures. PDU - Power distribution unit Pole - A row of power receptacles with power supplied from a PDU Pole Position - A power receptacle on a pole Pressure Differential - The difference in pressure between two locations in the data center used to analyze air flow behaviors PH - Phase, electrical phase 1-3 Plenum - A receiving chamber for air used to direct air flow PU - Packaged unit, an air handler designed for outdoor use. PUE - Power usage effectiveness, a measure of data center energy efficiency calculated by dividing the total data center energy consumption by the energy consumption of the IT computing equipment. This measure is the inverse of DCiE. Rack - Device for holding IT equipment, also called a cabinet RAH - Recirculation air handler, a device that circulates air but does not cool the air Raised Floor - Metal flooring on stanchions that creates a plenum for airflow and cabling, synonymous with RMF Recirculation - Chilled airflow returning to cooling units without passing through IT equipment, also referred to as short cycling Return Air - The heated air returning to air conditioning equipment RFI - Radio frequency interference Rh - Relative humidity RMF - Raised metal floor, an alternate term for the more commonly used term ‘raised floor' ROI - Return on investment, a measure of the amount of time required to recover an investment RPM - Revolutions per minute, used to measure fan speeds RPP - Remote power panel RTU - Rooftop unit, an air handler designed for outdoor use mounted on a rooftop. A typical application of a PU. S+S - System plus system SCFM - Standard cubic feet per minute, the volumetric flow rate of a gas corrected to standardized conditions of temperature, pressure and relative humidity Sensible Cooling Capacity - Cooling capacity related to dry bulb temperature and objects that do not produce condensation Sensitivity - An equipment setting that bounds the set point range and triggers a change in device function when exceeded. Most commonly referring to CRAC/CRAH temperature and humidity set points. Set Point - Typically used in reference to air conditioning equipment thermostat temperature and humidity settings Short Cycling - Chilled airflow returning to cooling units without passing through IT equipment, also referred to as recirculation STS - Static transfer switch Sub-Floor - The open area underneath a raised computer floor, also called a sub-floor plenum Supply Air - The cooled airflow emitted from air conditioning equipment TCE - Triton Coefficient of EffectivenessSM, synonymous with UCE Thermistor - A type of resistor with resistance varying according to its temperature U - Rack mount unit, the standardized height of one unit is 1.75" UCE - Upsite Coefficient of EffectivenessSM, synonymous with TCE UPS - Uninterruptible power supply, device used to supply short-term power to computing equipment for brief outages or until an alternate power source, such as a generator, can begin supplying power. VFD - Variable frequency drive W - Watt(s) Waterside Economizer - An economizer that redirects water flow to an external heat exchanger when the exterior ambient air temperature is at or below a temperature required to chill water to a given set point, simultaneously shutting down the mechanical chiller equipment. Wet-Bulb Temperature - The temperature of the air measured using a wet-bulb thermometer, typically taken in conjunction with a dry-bulb reading in order to determine relative humidity Wg - Inches of water column, an approximate unit of measurement for static air pressure Work Cell - The area of a rack and the related area immediately in front of and behind the rack. Standard racks are 2 feet wide and 4 feet deep. Standard aisles are 4 feet wide, so half of that space is workspace for a given rack. This results in a standard work cell of 16 square feet. Actual work cell size varies with data center design. WPSF - Watts per square foot


 The Mountain Hall

 Fire safety and fire
 Safe as a vault
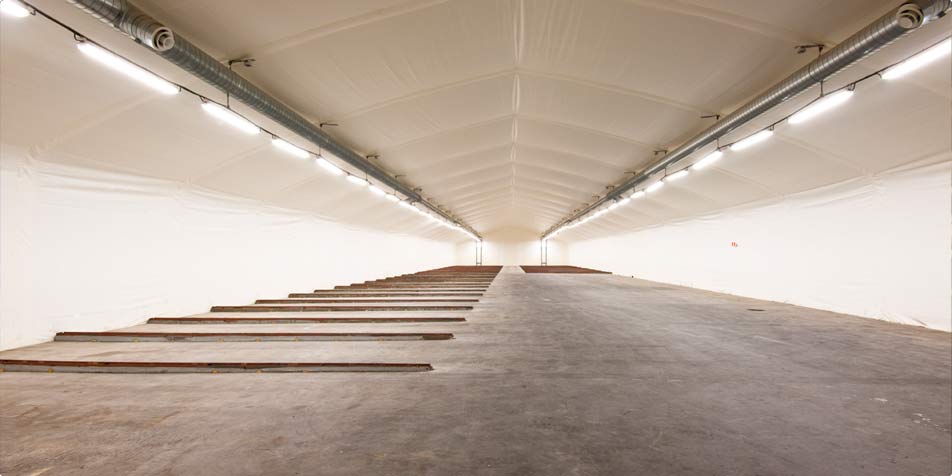

 Communication